KPIs for HR (or KPI) is a specific, measurable value that shows you how well your HR activities are actually helping the business hit its goals. It’s about moving beyond simple counts, like how many people you hired, to measuring what really matters, like how well those new hires perform and how long they stick around.
Moving Beyond Headcount to Strategic KPIs for HR
Imagine trying to fly a plane with only a fuel gauge. Sure, you’d know how much fuel you have left, but you’d have zero idea about your speed, altitude, or whether the engine is about to give out. Relying only on basic metrics like employee headcount is just as limiting. It tells you how many people you have, but it says nothing about their performance, their engagement, or how efficiently they’re working.
This is where a solid KPIs for HR framework becomes your complete cockpit dashboard.
Suddenly, you can see the whole picture. You’re not just tracking fuel (headcount), but also:
- Speed (Efficiency): How quickly and cost-effectively are we hiring the right people?
- Altitude (Engagement): How motivated, satisfied, and committed is our team?
- Engine Health (Retention): Are our best people staying and growing with us?
The Critical Difference Between a Metric and KPIs for HR.
Getting your head around the difference between a metric and a KPI is the first big ‘aha!’ moment for any leader. A metric tracks an activity; a KPI measures performance against a strategic business goal. They aren’t the same thing, and mixing them up leads to tracking a lot of data that has no real impact.
A metric tells you what happened; a KPI tells you if what happened actually mattered to the business. This shift in perspective is what elevates HR from an administrative function to a strategic partner.
For example, tracking the ‘number of new hires’ is a perfectly fine HR metric. It shows the recruitment team has been busy. But it doesn’t tell you if those hires were any good, or if they helped the company get closer to its objectives.
On the other hand, ‘quality of new hires’ is a powerful KPI. You could measure this by the percentage of new hires who meet or smash performance expectations in their first six months. This KPI directly links the hiring activity to a vital business outcome: building a high-performing team.
By embracing strategic KPIs for HR, you stop just counting people and start measuring what truly drives success. This data-first approach lets you spot problems early, predict future challenges, and prove HR’s direct contribution to the bottom line. It turns the people function into an engine for organisational health and growth.
The Four Pillars of Strategic HR Measurement
To build a people strategy that actually drives business results, you need a solid foundation. If you only focus on one thing, like hiring speed, but ignore what happens to people after they join, you’re setting yourself up for failure. A balanced approach is crucial; it organises your efforts and makes sure you’re not strengthening one part of the business at the expense of another.
A simple yet powerful way to structure your KPIs for HR framework is to think in terms of four essential pillars. Each pillar represents a critical stage of the employee lifecycle, and together they create a complete scorecard for organisational health.
1. Talent Acquisition
This is about much more than just filling empty seats. True strategic talent acquisition measures the long-term value and impact of every single new hire. It’s about answering one critical question: are we bringing the right people into the business to help us achieve our goals?
KPIs in this area look at the quality, efficiency, and effectiveness of your recruitment process. For example, instead of just tracking Time to Hire, a truly strategic KPI would be Quality of Hire, which measures a new employee’s performance and impact after six months on the job.
2. Engagement and Retention
Once you’ve hired brilliant people, the real challenge begins: keeping them motivated, engaged, and committed to the mission. This pillar acts as an early warning system, helping you spot the first signs of dissatisfaction or burnout before your best people start heading for the door.
Metrics here tell you about the health of your company culture and the stability of your workforce. Think of things like the Employee Net Promoter Score (eNPS) or employee satisfaction surveys. For instance, recent UK public sector data showed that even a slight increase in employee satisfaction to 83% correlated with a stable voluntary turnover rate of 10% year-to-date. It’s a clear example of how engaged teams create stability. You can dig into more public sector HR trends for further insights.
Measuring engagement and retention isn’t just a feel-good exercise. It’s a direct reflection of your leadership’s effectiveness and your organisation’s ability to keep its promises to its people.
3. Performance and Development
This pillar is all about growth for the individual and the organisation. It measures how effectively you are developing your team’s skills and managing performance to drive real business outcomes. Strong performance KPIs ensure your employees aren’t just busy, but are productive and fully aligned with strategic priorities.
Tracking metrics like Training Effectiveness or the Percentage of Employees with a Development Plan helps you spot skill gaps and create clear pathways for career progression.
4. Operational Efficiency
Finally, this pillar turns the lens inward to measure the HR function’s own effectiveness. It ensures your people processes are streamlined, cost-effective, and create a positive experience for employees. It answers a fundamental question: are we running a lean, effective HR operation that adds value without unnecessary friction or cost?
This diagram shows how these pillars come together to create a holistic HR dashboard, much like a pilot’s cockpit.
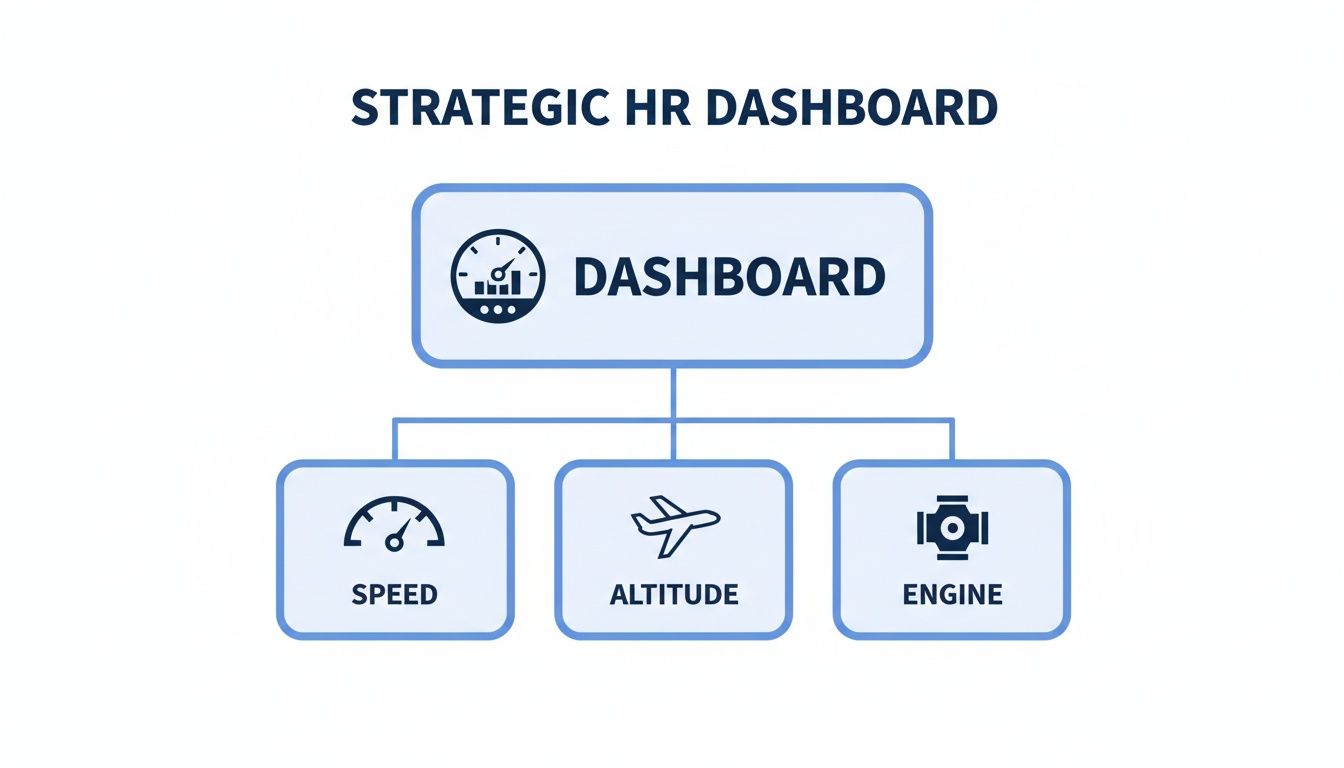
As the visualisation shows, a strategic HR dashboard has to monitor not just speed (efficiency) but also altitude (engagement) and engine health (retention) to fly successfully. By balancing these four pillars, you create a robust people strategy that supports every single facet of the business.
Right, we’ve covered the strategic pillars. Now it’s time to get our hands dirty and move from theory to action. This is your practical toolkit a breakdown of the most critical HR KPIs, complete with the formulas you need to calculate them and real-world examples that bring the numbers to life.
Think of each KPI as a diagnostic tool. Just like a doctor uses specific tests to check a patient’s health, these KPIs help you diagnose the health of your organisation, one crucial area at a time.
1. Employee Turnover Rate
This is one of the most fundamental KPIs for HR. It simply measures the percentage of employees who leave your organisation over a specific period. It’s a vital sign of workforce stability, employee satisfaction, and overall company health.
If your turnover is consistently high, it’s a massive red flag. It often points to deep-rooted problems in your culture, leadership, or compensation strategy.
Why It Matters: High turnover is incredibly costly. Beyond the obvious recruitment expenses, it leads to lost productivity, drains institutional knowledge, and can seriously damage the morale of the people who stay. Tracking it is your first line of defence.
The Formula:
Turnover Rate (%) = (Number of Employees Who Left ÷ Average Number of Employees) × 100
Real-World Example:
A tech scale-up notices its quarterly turnover rate has jumped from 5% to 12%. By digging into the data, the HR team discovers most leavers are from the product development team and left within 18 months of joining. The KPI didn’t just present a problem; it pointed them to a specific area to investigate revealing issues with project management and a lack of career progression for junior developers.
2. Time to Hire
Time to Hire measures the average number of days it takes from posting a job to a candidate accepting your offer. It’s a key metric for gauging just how efficient and effective your recruitment process really is.
Let’s be honest, a lengthy Time to Hire often means you’re losing top candidates to competitors who can move faster.
Why It Matters: A long hiring process frustrates candidates and puts a real strain on the teams left waiting for a new member. It can also shine a light on bottlenecks in your process, like slow feedback from hiring managers or a clunky interview structure.
The Formula:
Time to Hire (in days) = Date of Offer Acceptance - Date Job Was Opened
Learning Moment: A key learning for many teams is discovering where the time goes. For example, a company found their average Time to Hire was 55 days, with 20 of those days stuck between the final interview and the offer being sent. This insight led them to streamline their internal offer approval process, cutting their Time to Hire by two weeks and improving their offer acceptance rate.
3. Quality of Hire
This is arguably the most powerful talent acquisition KPIs for HR, but it’s also one of the trickiest to get right. Quality of Hire assesses the value a new employee actually brings to the company. It moves beyond speed and cost to measure the real-world impact of your hiring decisions.
A high Quality of Hire means your recruitment process is successfully finding people who not only excel in their roles but also strengthen the entire company.
Why It Matters: Hiring the wrong person is a massive drain on time, money, and team morale. Focusing on Quality of Hire ensures your talent strategy is directly contributing to business performance, not just filling empty seats.
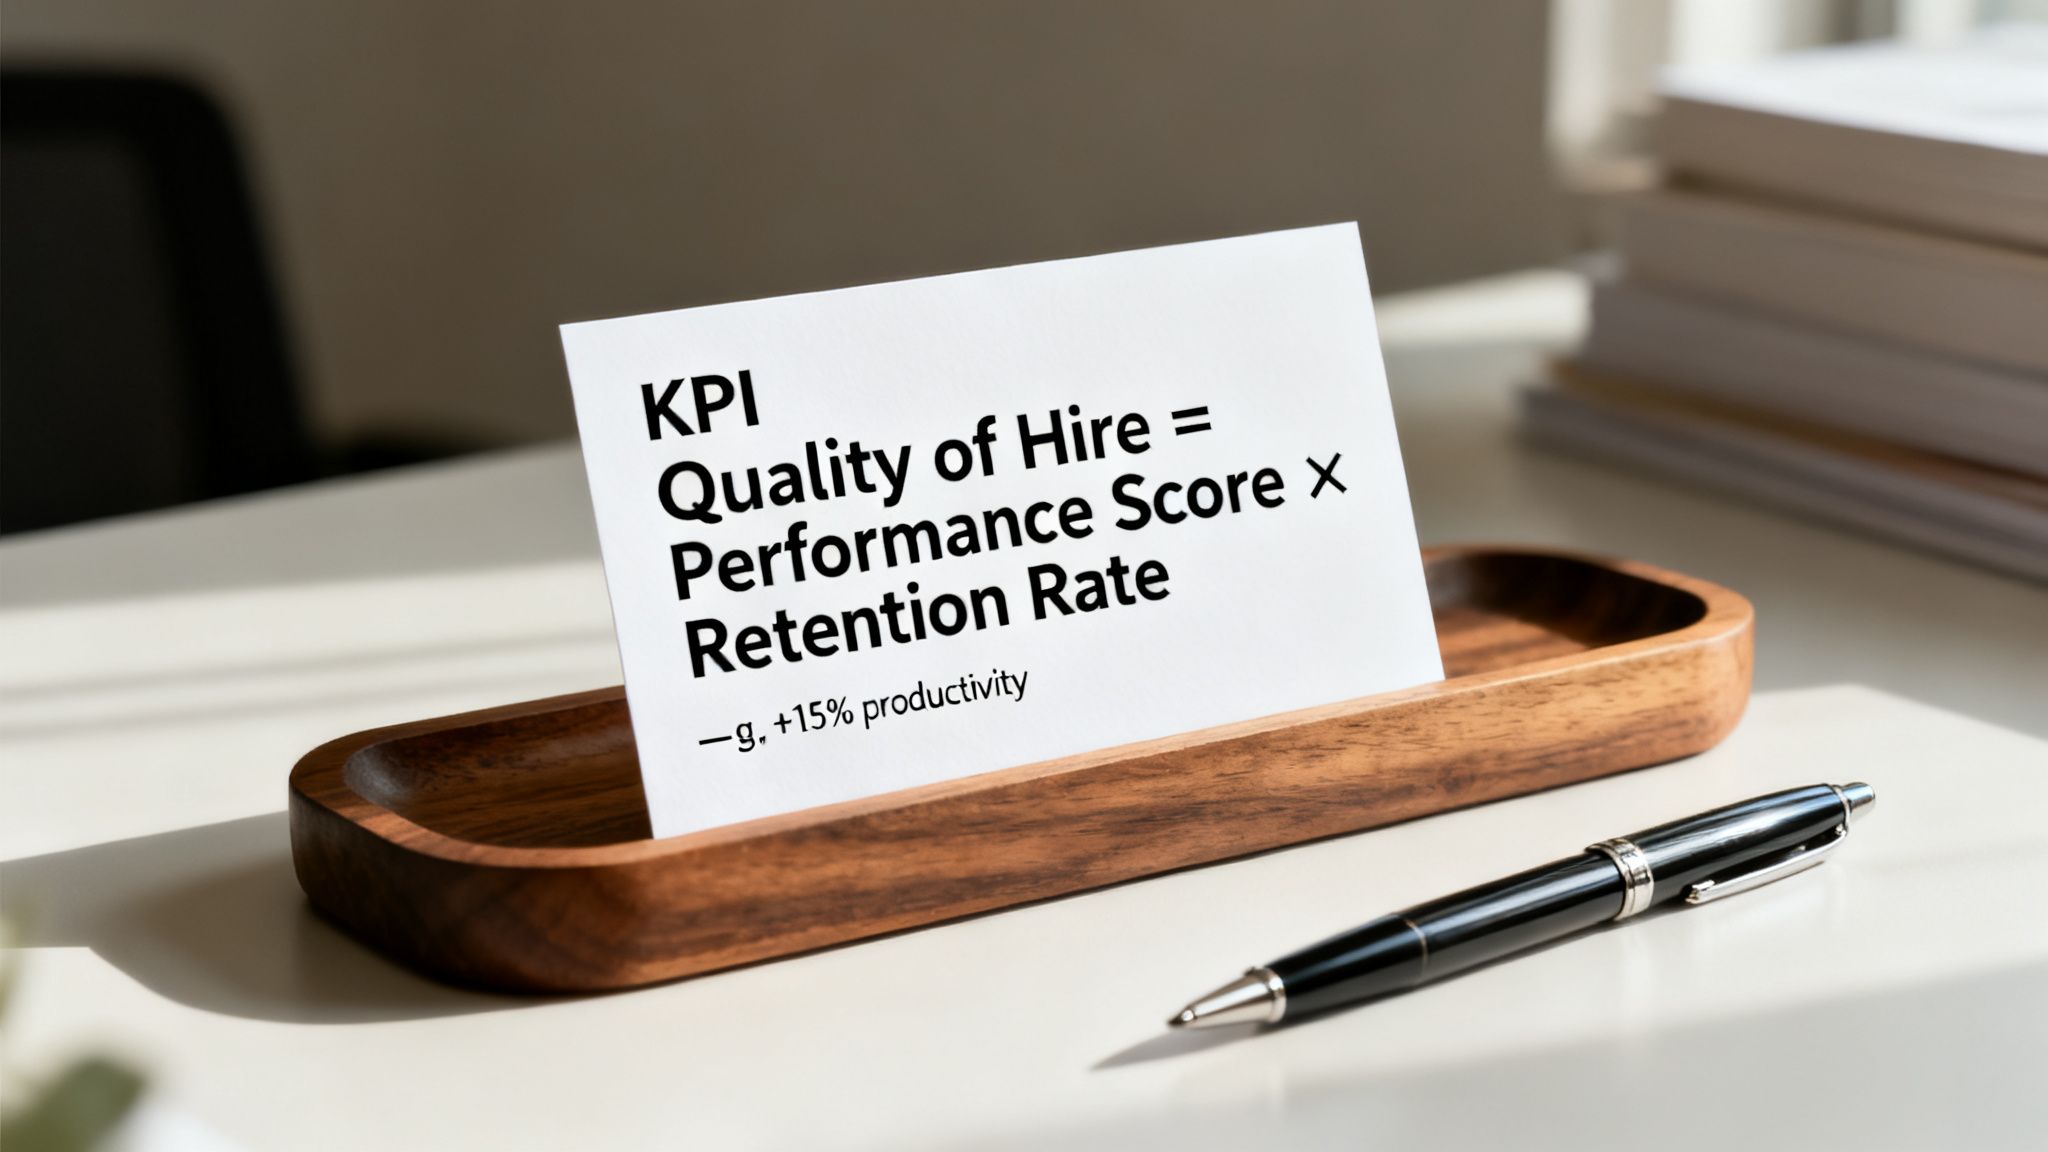
The Formula: There’s no single, universal formula, as it’s a composite metric. A common and effective approach is to average scores from several indicators:
Quality of Hire (%) = (New Hire Performance Score % + New Hire Retention Rate % + Hiring Manager Satisfaction %) ÷ 3
Real-World Example:
A fast-growing fintech company was obsessed with a low ‘Time to Hire’. They hired 10 developers in one quarter. Six months later, their ‘Quality of Hire’ KPI told a very different story. The new hires’ average performance score was a mediocre 65%, and their team’s overall productivity had dipped by 15% due to the extra coaching required. This was a critical lesson: hiring fast is a vanity metric if you’re not hiring well. They shifted their focus to a more robust technical assessment. Although Time to Hire increased by 10 days, their next cohort of hires had an average performance score of 92%.
4. Training Effectiveness
This KPI measures the impact of your training programmes on employee performance and skill development. It cuts through the noise to answer one simple question: “Is our investment in learning and development actually paying off?”
Tracking attendance is just a metric; measuring if that training improved performance is a true KPI.
Why It Matters: Companies invest significant sums in training. This KPI ensures that investment delivers a real return, whether it’s through improved sales figures, fewer customer complaints, or more efficient internal processes.
How to Measure It: This usually requires some pre- and post-training assessment.
- Assess Performance: Measure a team’s performance on a specific task before the training.
- Conduct Training: Deliver the training programme.
- Re-assess Performance: Measure performance on the same task after the training.
- Calculate Improvement:
Effectiveness (%) = ((Post-Training Score - Pre-Training Score) ÷ Pre-Training Score) × 100
Practical Example: A customer support team receives training on a new CRM system. Before the training, their average call handling time was 240 seconds. After the training, it dropped to 180 seconds. The training effectiveness was a 25% improvement, a tangible result that directly impacts customer satisfaction and operational costs.
For those looking to build a culture of continuous improvement, exploring how to structure an OKR for learning and development can provide a powerful framework to connect training initiatives directly to measurable business outcomes.
5. Absenteeism Rate
The Absenteeism Rate tracks the percentage of unplanned or unexcused absences from work. While some absence is unavoidable, a high rate can signal underlying issues like low employee morale, burnout, or poor management.
Think of it as a quiet but powerful barometer of your workplace environment.
Why It Matters: High absenteeism directly hits productivity and can increase costs through sick pay and the need for temporary cover. More importantly, it’s often an early warning sign of deeper cultural problems that need immediate attention.
The Formula:
Absenteeism Rate (%) = (Total Lost Workdays Due to Absence ÷ Total Number of Available Workdays) × 100
Top 5 KPIs for HR with Formulas and Benchmarks
To make things even easier, here’s a quick-reference table. It shows you how to calculate these essential KPIs for HR and what a good performance level might look like, especially in a fast-moving scale-up environment.
| KPI Name | Formula | Example Calculation | Good Benchmark (Scale-up) |
|---|---|---|---|
| Employee Turnover Rate | (Leavers ÷ Avg. Employees) × 100 | (10 Leavers ÷ 200 Avg. Employees) × 100 = 5% (Quarterly) | <15-20% Annually |
| Time to Hire | Date of Offer Acceptance – Date Job Was Opened | 15th May – 1st April = 45 Days | <45 Days |
| Quality of Hire | (Perf. % + Ret. % + Sat. %) ÷ 3 | (90% + 95% + 85%) ÷ 3 = 90% | >85% |
| Training Effectiveness | ((Post – Pre) ÷ Pre) × 100 | ((85 – 60) ÷ 60) × 100 = 41.7% Improvement | >25% Skill/Performance Lift |
| Absenteeism Rate | (Lost Days ÷ Total Days) × 100 | (50 Lost Days ÷ 10,000 Total Days) × 100 = 0.5% | <1.5% |
These benchmarks can vary by industry, but they provide a solid starting point for measuring the health of your people operations.
By consistently tracking these essential KPIs for HR, you transform your people function. You move from making decisions based on gut feeling to using data-driven insights that steer the organisation toward its most important goals.
Connecting HR KPIs to Business Objectives
Knowing how to calculate your turnover rate is a great start, but it’s only half the story. The real power of a KPIs for HR framework kicks in when you draw a straight line from your people data to the company’s biggest goals.
Without that connection, HR metrics are just interesting numbers on a spreadsheet. With it, they become hard evidence of HR’s impact on the bottom line.
This is where so many HR teams miss their moment. They track all this valuable data but don’t translate it into the language the C-suite understands. If you want a seat at the strategic table, you have to show how your people initiatives aren’t just ‘nice-to-haves’ they’re essential drivers of commercial success.
KPIs for HR Are Your Health Check, OKRs Are Your Destination
A simple way to think about this is to see KPIs and OKRs (Objectives and Key Results) as two sides of the same coin. They work together, but they do different jobs.
KPIs for HR are the gauges on your dashboard, constantly monitoring the health of the system. OKRs are your GPS, plotting a specific course to an ambitious new destination.
Imagine your company’s Employee Turnover KPI is holding steady at 15%. This KPI is like the oil pressure gauge in your car; you just need to keep an eye on it. As long as it stays in the green zone, things are ticking along nicely.
But what if the business sets a bold new Objective?
- Objective: Create an industry-leading employee experience to become an employer of choice.
Suddenly, that ‘healthy’ 15% turnover rate doesn’t look so great anymore. This is where the OKR framework comes in, helping you set a specific, measurable target to get you to that new destination.
- Key Result: Reduce voluntary turnover in the product team from 15% to 8% by the end of Q4.
See the difference? The KPI (turnover rate) gave you the baseline health check. The OKR set the ambitious, targeted goal for improvement. Your KPI tells you where you are; your OKR tells you where you’re going. Getting this distinction right is fundamental to achieving genuine strategic alignment in your business.
From Company Goals to HR Impact through KPIs for HR
To make this connection practical, you need a clear process for cascading company-level goals down to specific HR initiatives and the KPIs that track them. It’s all about working backwards from the business objective.
Let’s walk through a real-world example.
Say your company’s top strategic goal for the year is to increase market share by 20%. On the surface, this sounds like a sales and marketing goal, but a savvy HR leader knows that people are what will make or break that effort.
Here’s how you connect the dots:
Break Down the Business Goal: To grab more market share, the sales team needs to be bigger, better, and hitting their targets faster than the competition. They can’t afford to have new hires spending months getting up to speed.
Define the HR Initiative: The HR priority becomes crystal clear: “Accelerate the productivity of new sales hires.” This is the core project that will directly support the company’s main objective.
Find the Right HR KPI: Now, you need a way to measure whether this initiative is actually working. The perfect KPI here is Time to Productivity, which tracks how long it takes a new starter to become fully effective in their role.
Set a Clear Target: Let’s say your current Time to Productivity for sales reps is 90 days. To support that aggressive market share goal, you set a new target to slash this to 60 days.
All of a sudden, HR isn’t just “doing recruitment.” You are actively “reducing new hire ramp-up time to drive market share growth.” By tracking this specific KPIs for HR, you create a clear, quantifiable link between your team’s work and the company’s financial success. This is how you prove your value and build a truly data-driven people strategy.
Putting Your HR KPIs into Action
Knowing your KPIs is one thing, but actually using them to drive change is a completely different game. You’ve got the formulas and you understand how they link back to the business goals – that’s the foundation. Now, it’s time to build a practical, sustainable system for tracking and reporting.
Let’s be clear: this isn’t about tracking every metric you can think of. It’s about picking the right ones for where your company is right now and turning that data into clear, actionable insights your leadership team can digest in minutes.
Select KPIs That Match Your Company Stage
The HR metrics that matter most are completely tied to your organisation’s current reality. A 50-person startup has wildly different priorities than a 5,000-employee enterprise, and your KPIs have to reflect that. If you try to track enterprise-level metrics in a startup, you’re just creating noise and wasting effort.
For Startups (10-100 Employees): Your world is all about survival, growth, and building a core culture. Your absolute essentials are Time to Hire (to get the right people in quickly), Quality of Hire (to make sure they’re brilliant), and Employee Turnover Rate (to keep your small, vital team from walking out the door).
For Scale-ups (100-500 Employees): Things are getting more formal, and holding onto that unique culture is a real challenge. At this point, you’ll want to bring in metrics like Employee Engagement Score (eNPS) to get a pulse on morale at scale and Time to Productivity to make sure new hires are getting up to speed effectively.
For Enterprises (500+ Employees): The focus shifts to optimisation, efficiency, and managing risk. KPIs like Absenteeism Rate, Cost Per Hire, and Internal Promotion Rate become vital for managing a large workforce and building clear career paths.
Establish Your Baseline First
You can’t prove you’ve improved if you don’t know where you started. Before you kick off any new initiative, you absolutely must establish a baseline for your chosen KPIs. This isn’t a nice-to-have; it’s the first step.
A baseline turns abstract data into a powerful story of progress. Without it, you’re just collecting numbers with no context. With it, you can demonstrate tangible improvement and prove the ROI of your HR initiatives.
For instance, if you want to improve retention, your first move is to calculate your current Employee Turnover Rate over the last 12 months. Let’s say it’s 22%. That number is your baseline. Now, when you roll out new engagement programmes and that rate drops to 17% six months later, you have a data-backed success story to tell. Simple as that.
Choose the Right Tools for the Job
Your tools need to fit your team’s size and complexity. Over-engineering with a complicated system too early creates pointless admin, while clinging to spreadsheets for too long leads to chaos.

- Lean Teams: Simple spreadsheets like Google Sheets or Excel are perfect for getting started. They’re free, flexible, and brilliant for tracking a handful of core KPIs when your headcount is small.
- Growing Organisations: As you scale, a dedicated Human Resources Information System (HRIS) becomes non-negotiable. Platforms like Factorial or Personio pull all your data into one place, automate reporting, and give you visual dashboards that make tracking a breeze.
As HR and people leaders, staying on top of how technology and data can shape strategy is part of the job. It’s well worth exploring resources built specifically for HR and People Leaders to get deeper insights into aligning your work with modern business demands.
Create a Consistent Reporting Rhythm
Finally, data is useless if no one looks at it. Setting up a consistent reporting rhythm ensures your KPIs stay relevant and actually drive decisions. But a word of warning: not every KPI needs to be scrutinised with the same frequency.
Your cadence should match the nature of the metric:
- Monthly Review (Operational KPIs): These are your faster-moving metrics. Look at Time to Hire, Absenteeism Rate, and recruitment pipeline data every month. This helps you spot short-term trends and fix operational snags before they become bigger problems.
- Quarterly Review (Strategic KPIs): These metrics tell a deeper, longer-term story. Review Employee Turnover, Quality of Hire, and Engagement Scores quarterly. This timing fits perfectly with business-wide strategic reviews and helps shape your goals for the next quarter.
Present your findings in a clean, visual dashboard. Use simple charts and call out the key takeaways. Your leadership team shouldn’t have to hunt through a spreadsheet; they should be able to grasp the state of your people operations in five minutes flat.
Common KPIs for HR Traps and How to Avoid Them
Learning from others is the fastest way to get ahead. Even the most carefully planned HR strategies can get knocked off course by a few common mistakes when you start using a KPIs for HR framework. If you know what these traps look like, you can sidestep them and build a measurement system that actually delivers.
Too many organisations fall into these traps because they get fixated on the act of measuring, rather than asking what those measurements really mean for the business. Let’s walk through the most common slip-ups and, more importantly, how to avoid them completely.
The Vanity Metric Overload
The first and most common trap is drowning in “vanity metrics.” These are the numbers that look great in a presentation but have zero connection to real business outcomes. Think tracking ‘likes’ on an internal company post or counting how many people finished an optional, non-essential training course.
These metrics make you feel busy and productive, but they just create noise. They burn time and resources while telling you nothing meaningful about performance, engagement, or efficiency. The result? A dashboard packed with data that no one in leadership actually cares about.
How to Avoid It:
- Start with Business Goals: What are the company’s top three strategic objectives this year? Pin them down first.
- Work Backwards: For each goal, ask: “Which one or two people-focused outcomes are absolutely essential to making this happen?”
- Be Ruthless: If a metric doesn’t directly track progress towards one of those critical outcomes, get rid of it. A focused set of 5-7 powerful KPIs is infinitely better than 25 meaningless ones.
Ignoring the Story Behind the Numbers
The second big pitfall is reporting numbers without any context. A slide that just says “Employee Turnover is 18%” is a massive missed opportunity. On its own, that number is just data; it’s not an insight. It doesn’t tell you why it’s happening, who is leaving, or what damage it’s causing.
Without a story, leaders are left to guess, and their guesses might be completely wrong. Your role isn’t just to report data; it’s to be the storyteller who turns raw numbers into a clear narrative that sparks action.
A number tells you what happened. The story explains why it happened and what you should do about it next. This is the difference between reporting data and providing genuine business intelligence.
How to Avoid It:
- Segment Your Data: Never just report the overall turnover rate. Isolate it by department, manager, tenure, and performance level. Are your top performers walking out the door? That’s a five-alarm fire, not just a statistic.
- Connect to Other KPIs: Did your Employee Engagement Score take a nosedive just before that spike in turnover? Weaving different data points together creates a much richer, more convincing story.
- Provide Recommendations: Never bring a problem to the table without a proposed solution. For instance: “Our turnover is 18%, driven mainly by the engineering team. Exit interviews point to a lack of career progression. We recommend implementing a technical career ladder.”
Common Questions About KPIs for HR
It’s natural to have a few questions when you start digging into HR KPIs. Here are some straight answers to the things we get asked most often, designed to give you clarity and get you moving.
How Many KPIs for HR Should We Track?
Less is more. It’s a classic mistake to track everything you can, which just creates noise and confusion.
Start with 5-7 KPIs that connect directly to your most important business goals for the year. For most growing companies, a core set like Quality of Hire, Employee Turnover Rate, and Employee Engagement Score gives you a powerful, focused view. You can always add more as your people analytics muscle grows.
What’s the Difference Between HR Metrics and KPIs for HR?
Think of it like this: a metric measures an activity, while a KPI measures its strategic impact.
For example, tracking the ‘number of training hours completed’ is a metric. It shows you what’s happening. But measuring the ‘improvement in team performance post-training’ is a KPIs for HR because it ties that activity directly to a business outcome. All KPIs are metrics, but only the ones that measure progress against a core goal earn the title of KPI. Getting this distinction right is the key to measuring what actually matters.
At The OKR Hub, we specialise in helping HR and people leaders connect their initiatives to measurable business results. Learn how our expert-led OKR services can align your people strategy with company goals.
